
When the Numbers Lie
How to Spot Misleading Financial Narratives


Numbers are supposed to bring clarity. They’re supposed to anchor decisions, reveal truth, and cut through noise. But in the real world — in boardrooms, investor decks, nonprofit reports, and quarterly business reviews — numbers often do the opposite. They distort. They distract. They mislead.
Not because people are malicious. But because numbers, when used without discipline, can tell almost any story you want them to tell.
This is the uncomfortable truth:
Most financial narratives are not lies — they’re interpretations. And interpretations can be engineered.
For leaders, operators, and anyone responsible for making decisions that affect people, budgets, or strategy, the ability to detect misleading financial narratives is no longer optional. It’s a core competency.
Because when the numbers lie — or when they’re allowed to tell only the part of the truth that flatters — organizations drift. Leaders make poor decisions. Teams lose trust. And the gap between reality and reporting widens until something breaks.
The good news? Misleading narratives follow patterns. And once you know what to look for, you can spot them instantly.
The Illusion of Precision
Financial numbers look authoritative. They’re clean, specific, and often presented with decimal‑level confidence. But precision is not the same as accuracy.
- A forecast can be precise and completely wrong.
- A metric can be precise and strategically meaningless.
- A dashboard can be precise and still hide the real story.
The first step in spotting misleading narratives is recognizing that numbers are not neutral. They’re shaped by:
- The timeframe chosen
- The denominator selected
- The comparison point used
- The exclusions applied
- The incentives behind the reporting
Once you understand this, you stop taking numbers at face value and start interrogating the architecture behind them.
Five Ways Financial Narratives Mislead
Let’s break down the most common patterns — the ones that show up in every industry, every sector, and every leadership environment.
1. Selective Timeframes: The Oldest Trick in the Book
- If you want to make a trend look good, you shorten the timeframe.
- If you want to make a trend look bad, you lengthen it.
- A revenue chart that starts in a dip will always look like growth.
- A churn chart that ends before a spike will always look stable.
- A cost chart that excludes the last two months will always look controlled.
Timeframes are narrative weapons.
The question to ask:
Why did we choose this timeframe, and what happens if we widen it?
High‑performers always zoom out before they zoom in.
2. Blended Averages: Where Truth Goes to Hide
Averages are useful — until they aren’t.
A blended average can hide:
- A failing product line
- A high‑performing segment masking a weak one
- A customer cohort that is quietly churning
- A cost center that is spiraling
A company with two divisions — one growing 40%, one shrinking 20% — can still report “10% growth.”
That number is technically true and strategically useless.
The question to ask:
What does this look like when disaggregated?
If the answer changes the story, the average was hiding something.
3. Vanity Metrics: Numbers That Look Good and Mean Nothing
Vanity metrics are the metrics that make people feel successful without actually driving success.
Examples include:
- Total users instead of active users
- Impressions instead of conversions
- Gross revenue instead of contribution margin
- “Engagement” without defining what engagement means
- Pipeline value without probability weighting
Vanity metrics are dangerous because they create the illusion of progress. They reward activity instead of outcomes.
The question to ask:
What decision does this metric actually inform?
If the answer is “none,” it’s vanity.
4. Story‑First Reporting: When the Narrative Drives the Numbers
This is the most subtle — and the most common — form of misleading reporting.
Instead of letting the data shape the story, the story is chosen first and the data is curated to support it.
You’ll hear phrases like:
- “If you remove this one‑time cost…”
- “If you normalize for seasonality…”
- “If you exclude the transition period…”
- “If you adjust for the onboarding ramp…”
Sometimes these adjustments are legitimate. Sometimes they’re excuses dressed up as analysis.
The question to ask:
What would the story be without the adjustments?
If the narrative collapses, the adjustments were doing too much work.
5. Benchmark Manipulation: The Art of Choosing the Right Comparison
Benchmarks are powerful — and easily abused.
You can make performance look strong by comparing against:
- A weak competitor
- An outdated industry average
- A non‑comparable peer group
- A cherry‑picked timeframe
- A metric that doesn’t reflect your business model
Benchmarks should illuminate, not camouflage.
The question to ask:
Is this the benchmark we would use if the results were reversed?
If not, the benchmark was chosen for convenience, not accuracy.
Why Misleading Narratives Take Hold
Most misleading narratives don’t come from bad actors. They come from:
Incentives - People report what they’re rewarded for.
Pressure - Leaders want to show progress, even when the system isn’t producing it.
Fear - Teams avoid surfacing bad news because they don’t trust how leadership will react.
Complexity - When systems get complicated, people simplify — sometimes too much.
Distance - Executives far from the work rely on dashboards that filter out nuance.
This is why operational empathy — understanding the lived experience behind the numbers — is so important. Numbers without context are noise.
How High‑Performing Leaders Detect Misleading Narratives
The best leaders don’t just read numbers. They interrogate them.
Here’s how they do it:
1. They ask for the raw data.
Not the slide. Not the summary. The source.
2. They look for the denominator.
Most misleading metrics hide in the denominator, not the numerator.
3. They compare multiple timeframes.
If the story changes when the window changes, something’s off.
4. They ask for cohort analysis.
Cohorts reveal what averages hide.
5. They look for the friction behind the numbers.
If the system is struggling, the numbers will eventually show it — even if the narrative hasn’t caught up.
6. They reward truth over optics.
Teams tell the truth when leaders make truth safe.
The Cost of Believing the Wrong Story
When leaders accept misleading narratives, the consequences compound:
- Strategy drifts
- Resources get misallocated
- Teams lose trust
- Problems go unaddressed
- Customers feel the downstream impact
- Culture becomes defensive instead of transparent
Misleading narratives don’t just distort performance. They distort reality.
And once reality is distorted, everything else becomes harder — forecasting, planning, execution, alignment, and culture.
Building a Culture Where Numbers Tell the Truth
The solution isn’t more dashboards or more metrics. It’s more honesty. High‑performing organizations build cultures where:
- Bad news travels fast
- Metrics reflect reality
- Leaders reward transparency
- Teams feel safe surfacing friction
- Data is used to learn, not to punish
- Narratives follow the numbers, not the other way around
When numbers tell the truth, organizations move faster. When narratives match reality, teams align. When leaders see clearly, they lead clearly.
The Leader’s Responsibility
At the end of the day, numbers don’t lie — people do, often unintentionally, through omission, framing, or selective interpretation.
It’s the leader’s job to:
- Ask better questions
- Challenge convenient narratives
- Look beyond the dashboard
- Understand the system behind the metric
- Reward truth even when it’s uncomfortable
Because clarity is not a luxury. It’s a leadership obligation.
And in a world where numbers can tell any story, the leaders who insist on the real one are the ones who build organizations that last.
About the Creator
Thomas McCorry
Thomas McCorry is a seasoned finance executive with 20 years at Constellation Brands, driving strategy, efficiency, and growth across global beer, wine, and spirits divisions.
Portfolio : http://thomasmccorry.com/
Keep reading
More stories from Thomas McCorry and writers in Education and other communities.
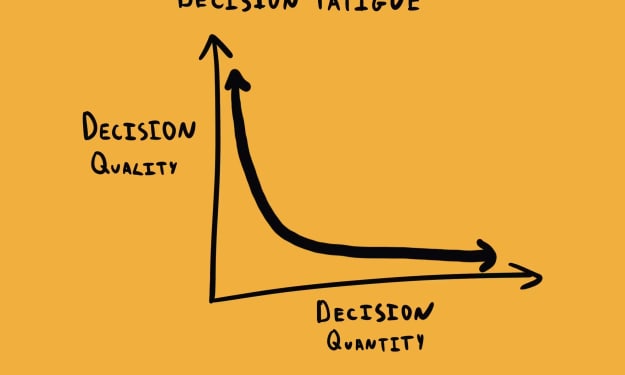
Decision Fatigue: Why Infinite Choice Exhausts the Modern Mind
We live in an age of abundance. Choices surround us at every turn—what to eat, what to watch, where to work, how to invest, even who to follow. On the surface, this abundance feels liberating. More options mean more freedom, more opportunity, more empowerment. Yet beneath the surface lies a paradox: the more choices we face, the more exhausted we become. Decision fatigue is the hidden tax of modern life, and the myth of infinite choice is its most seductive illusion.
By Thomas McCorry2 months ago in Education
Inside the Formula Behind Broadway's Biggest Smashes
Broadway is the pinnacle of live theater, where dreams are made, legends are born, and standing ovations echo through the ages. But not every show that lights up Times Square becomes a blockbuster. For every Hamilton or The Lion King, dozens of productions quietly close after a few weeks. So what’s the secret behind Broadway’s biggest hits? It turns out there’s a delicate, high-stakes formula—a mix of art, timing, talent, and savvy marketing—that separates the unforgettable from the forgettable.
By Producer James Simona day ago in Education
Empathy as a Guiding Force in the Future of Digital Financial Services
The role of empathy in the future of digital financial services is becoming more important as technology continues to expand. While digital tools offer speed and convenience, customers still want to feel understood and supported. They want financial experiences that respect their emotions, simplify their decisions, and guide them through moments of uncertainty. Empathy allows financial institutions to design digital services that respond to real human needs rather than relying solely on automated functions. This shift toward empathy-driven design strengthens trust and creates meaningful connections between customers and their financial providers.
By Jason Barakat5 days ago in Education


Comments
There are no comments for this story
Be the first to respond and start the conversation.