
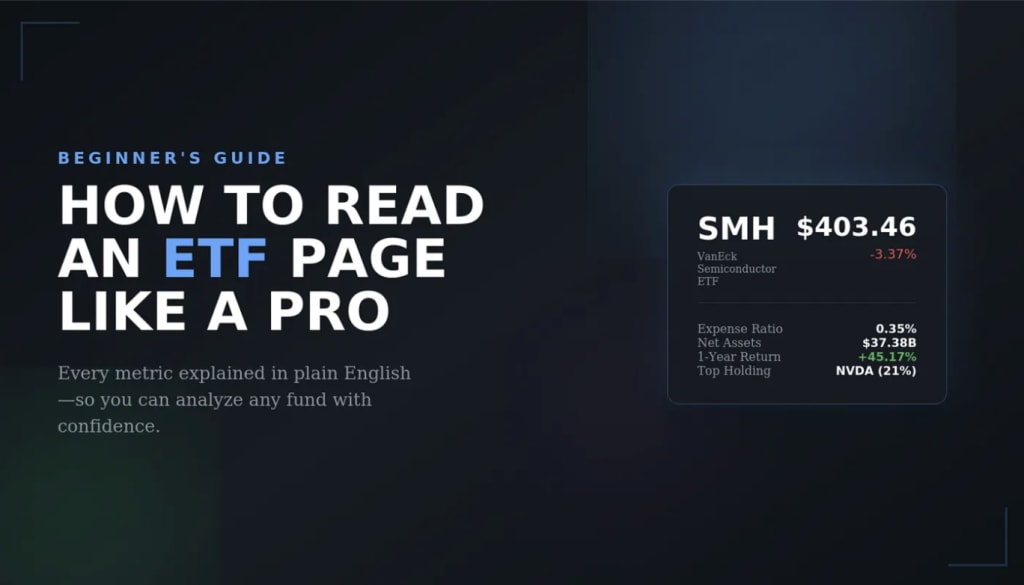
How To Read An ETF Page Like A Pro (Complete Beginner's Guide)
Everything on an ETF page explained in plain English - using SMH as our example (Since I'm bullish on semis right now)

If you've ever pulled up an ETF page and felt like you were reading hieroglyphics, you're not alone. I still remember laying eyes on hieroglyphics in elementary, still can't read them.
There's an overwhelming amount of information crammed onto these pages, and unless someone walks you through it, most of it might as well be written in a foreign language.
Today, I'm going to change that.
I'll walk you through every section of an ETF page, explain what each number actually means, and show you what to pay attention to (and what you can safely ignore).
I'm using SMH - the VanEck Semiconductor ETF - as our example, but everything you learn here applies to any ETF you'll ever research.
By the end of this article, you'll be able to analyze any fund on your own with confidence or at least better than before.
Got questions? Drop them in the comments.
Let's dive in.
Price & Basic Info
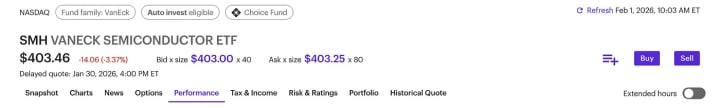
Ticker Symbol (SMH) - Think of this as the ETF's nickname. Every ETF has a unique ticker that you'll use to look it up or place a trade. SMH stands for the VanEck Semiconductor ETF, though the letters don't always spell out something obvious.
Current Price ($403.46) - This is what one share costs right now. If you wanted to buy into this ETF today, you'd pay roughly $403 per share.
Daily Change (-$14.06 / -3.37%) - This shows how much the price has moved since yesterday's close. Red means it went down. Green means it went up.
In this case, SMH dropped over 3% in a single day - a significant move.
Extended Hours ($403.03) - The stock market's regular hours run from 9:30 AM to 4:00 PM Eastern. But trading doesn't completely stop after that. Extended hours (also called pre-market and after-hours trading) show you where the price is moving outside of normal hours. Volume is lower during these times, so prices can be more volatile.
Key Statistics
This column tells you what happened with the ETF's trading activity today and recently.
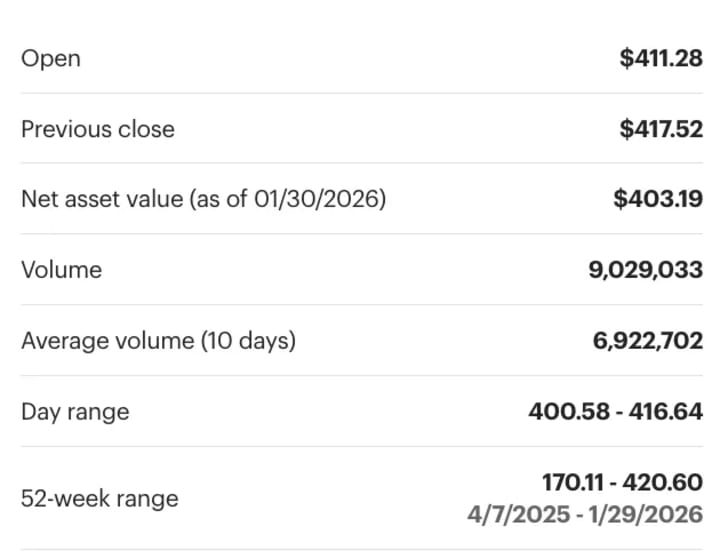
Open ($411.28) - This is where the price started when the market opened this morning. Comparing it to the previous close tells you whether the ETF gapped up or down at the open.
Previous Close ($417.52) - Where the price ended yesterday. Notice that SMH opened at $411 but closed at $417 the day before - that's called "gapping down" at the open, which often signals selling pressure.
Net Asset Value / NAV ($403.19) - This is the actual calculated value of everything inside the ETF, divided by the number of shares. The market price and NAV should be very close. If they're far apart, something unusual is happening.
Volume (9,028,033) - This tells you how many shares have been traded today. Higher volume means more buyers and sellers are active, which typically means tighter spreads and easier execution when you trade.
Average Volume (6,922,702) - The average number of shares traded over the past 10 days. Comparing today's volume to the average tells you if there's unusual activity. In this case, volume is significantly higher than average - often a sign of a big news day or market-wide movement.
Day Range ($400.58 - $416.64) - The lowest and highest prices the ETF hit during today's trading session. This shows you the intraday volatility.
52-Week Range ($170.91 - $420.60) - This is one of the most useful numbers on the entire page. It shows you the lowest and highest prices over the past year.
SMH's range tells us it nearly doubled from its lows - and right now, we're trading near the top of that range. That context matters when deciding whether to buy.
More Key Statistics
This column tells you about the structure of the ETF itself - not just today's price action.
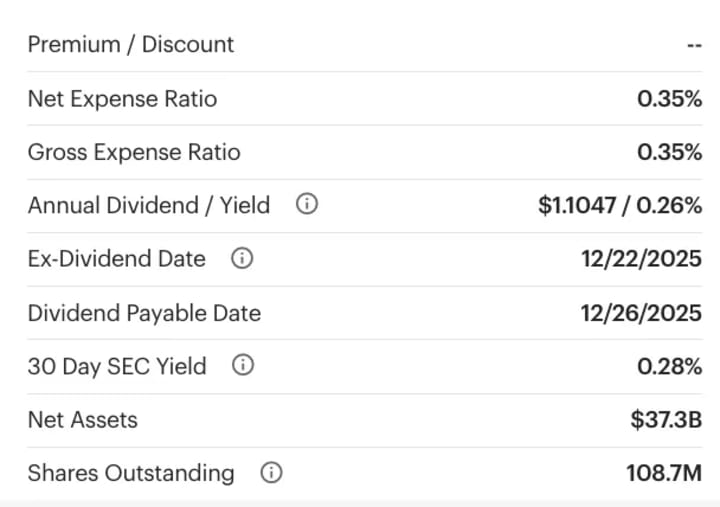
Net Expense Ratio (0.35%) - This is the annual fee you pay to own the ETF. It's automatically deducted from the fund's returns, so you'll never see a bill. For every $1,000 you invest, you're paying $3.50 per year. Anything under 0.5% is reasonable for a sector ETF. Broad market ETFs like VOO charge as little as 0.03%.
Gross Expense Ratio (0.35%) - Sometimes funds waive part of their fees temporarily, which creates a difference between gross and net. When they're the same (like here), there are no fee waivers in place.
Annual Dividend Yield (0.26%) - This tells you how much income the ETF pays out relative to its price. SMH's yield is tiny because semiconductor companies typically reinvest profits into growth rather than paying dividends. If passive income is your goal, look for ETFs yielding 2% or more.
Ex-Dividend Date (12/22/2025) - To receive the next dividend payment, you must own the ETF before this date. Buy on or after this date, and you'll have to wait for the following quarter's payment.
Dividend Payable Date (12/26/2025) - This is when the dividend actually hits your account.
Net Assets ($37.38 Billion) - This tells you the total size of the fund. Larger funds are generally more stable, more liquid, and less likely to shut down. SMH is a massive fund, so no concerns here.
Shares Outstanding (108.7M) - The total number of shares that exist for this ETF. This number can change as the fund creates or redeems shares based on demand.
The Chart: Visualizing Price History
The chart gives you a visual representation of where the price has been over time. Most platforms let you toggle between different timeframes:
- 1 Day (1D) - Useful for day traders, not so much for long-term investors
- 1 Month (1M) - Shows recent momentum
- Year to Date (YTD) - How the ETF has performed since January 1st
- 1 Year (1Y) - A solid timeframe for evaluating recent performance
- 5 Year (5Y) - The view long-term investors should focus on
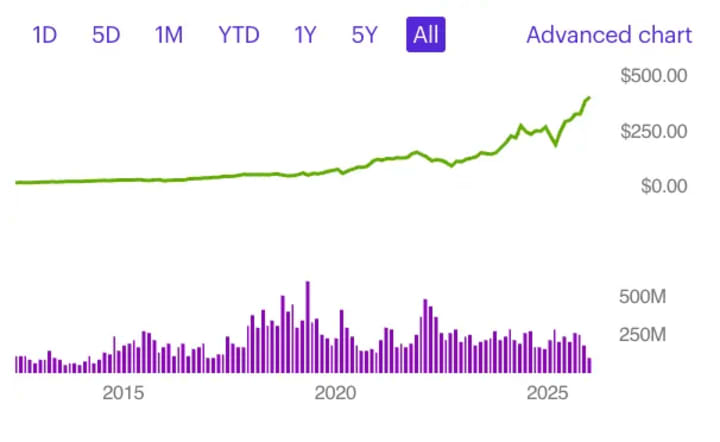
When analyzing an ETF, I recommend zooming out to the 5-year view first. You want to see the overall trend. Is it consistently moving up over time? Has it been choppy and sideways? Did it crash and never recover?
SMH has been on a monster run thanks to the AI boom. Semiconductors - the chips that power everything from iPhones to data centers - have been in unprecedented demand. The chart reflects that story clearly.
The Strategy Section: What This ETF Actually Does
This section explains the ETF's purpose and approach in plain terms.
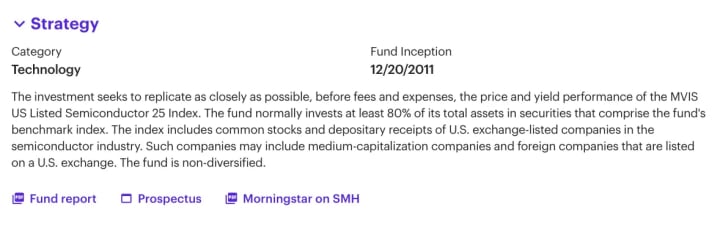
Category: Technology - This tells you SMH belongs to the tech sector. It's not a broad market fund; it's concentrated in one area of the economy.
Fund Inception: 12/20/2011 - SMH has been around for over a decade, which is a good sign. Newer funds have less of a track record to evaluate.
Investment Objective - The description explains that SMH seeks to replicate the MVIS US Listed Semiconductor 25 Index.
Translation: the fund owns the 25 largest semiconductor companies listed in the US, and its goal is to match that index's performance as closely as possible.
This is crucial information because it tells you this is a sector ETF, not a diversified fund. Sector ETFs carry more risk than broad market funds like SPY or VTI because they're concentrated in one industry. When semiconductors boom, SMH booms. When semiconductors crash, there's nowhere to hide 💀.
Top 10 Holdings: The Most Important Section
If you only look at one section on the entire page, make it this one.
The holdings tell you exactly what companies are inside this ETF. When you buy a single share of SMH, you're actually buying small pieces of all these companies at once.
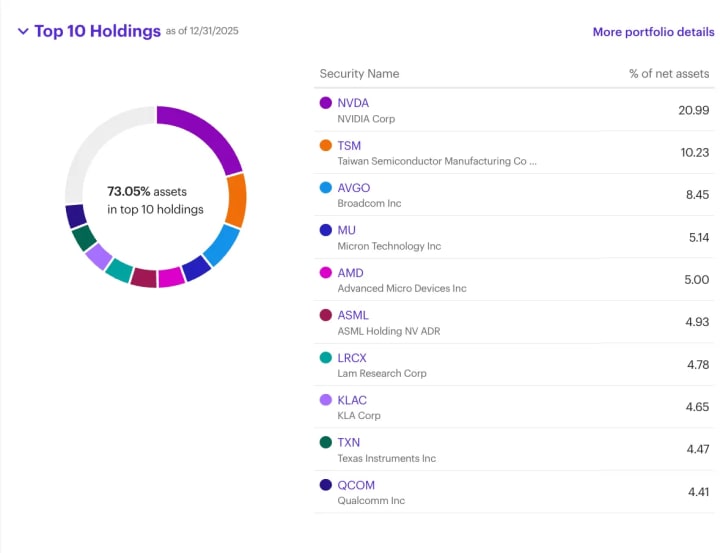
Here's what SMH holds:
- NVIDIA NVDA 20.99%
- Taiwan Semiconductor TSM 10.23%
- Broadcom AVGO 8.45%
- Micron Technology MU 5.14%
- AMD 5.00%
- ASML Holdings ASML 4.93%
- Lam Research LRCX 4.78%
- KLA Corp KLAC 4.65%
- Texas Instruments TXN 4.47%
- Qualcomm QCOM 4.41%
The concentration warning: Notice that the top 10 holdings make up 73.05% of the entire fund. That's significant concentration. More than one-fifth of the fund is in a single stock - NVIDIA.
This means if NVIDIA has a bad earnings report or faces regulatory issues, the entire ETF will feel the pain disproportionately. If you're looking for broad diversification, this isn't it. But if you're bullish on semiconductors and want exposure to the biggest players without picking individual stocks, this concentration in industry leaders might be exactly what you want.
Performance: The Report Card
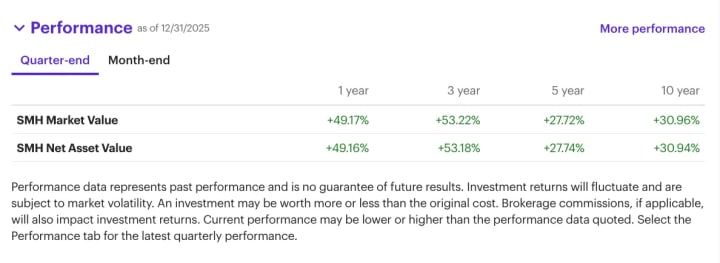
This is where you see how the ETF has actually performed over time.
1 Year: +45.17% - Exceptional. The S&P 500 averages about 10% annually over the long term. SMH more than quadrupled that in a single year.
3 Year: +53.22% - Strong cumulative returns over three years.
5 Year: +277.45% - Nearly 4x your money in five years.
10 Year: +1,093.94% - If you invested $10,000 in SMH ten years ago, you'd have over $100,000 today.
These numbers are remarkable - -but they come with an important caveat that's written right on the page: "Performance data represents past performance and is no guarantee of future results."
Semiconductors have been in a historic bull run driven by AI, cloud computing, and digital transformation. That doesn't mean the next 10 years will look the same. Sectors rotate. What's hot today can go cold tomorrow. Use past performance to understand what the fund has done, not to predict what it will do.
Dividend History
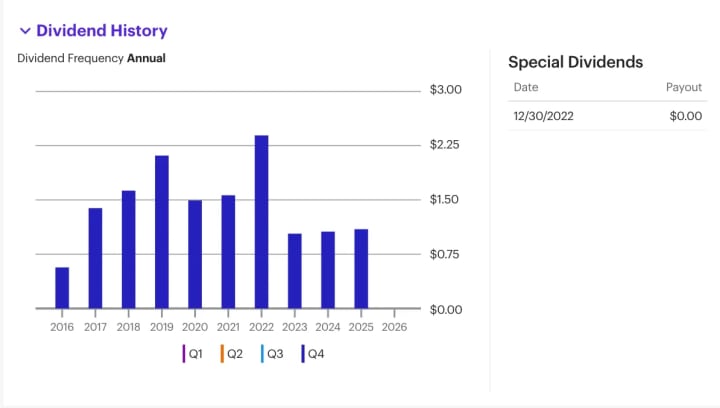
If you're interested in income investing, this section shows you the ETF's dividend track record.
SMH has paid dividends consistently, but the amounts fluctuate. You'll see payments ranging from $0.75 to $3.00 depending on the quarter. Special dividends occasionally appear as well.
The key takeaway: SMH is not a dividend-focused ETF.
The 0.26% yield is negligible.
You buy this fund for growth, not income.
If passive income is your priority, look at dividend ETFs like SCHD, VYM, or JEPI instead.
Fund Ratings
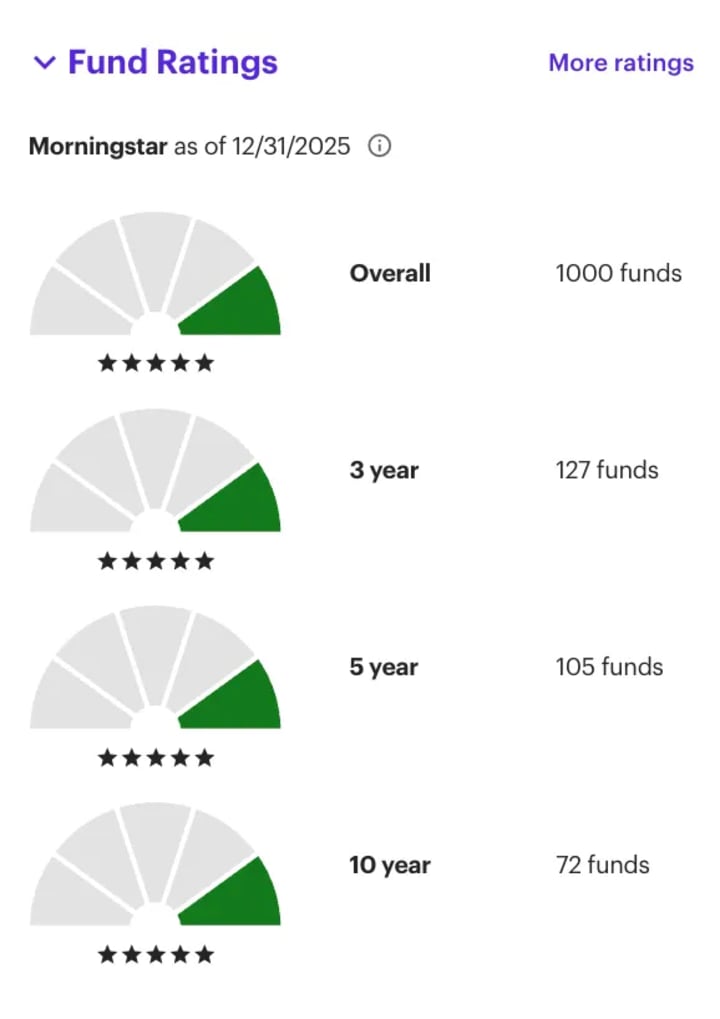
Morningstar provides independent ratings that help you compare funds within the same category.
Ratings are given for different time periods (3-year, 5-year, 10-year) and are measured in stars - one to five.
More stars indicate stronger risk-adjusted performance compared to peers.
SMH rates well, which makes sense given the returns we just reviewed. These ratings offer a quick way to see if you're looking at a top-tier fund or a laggard within its category.
Similar Funds: Comparing Your Options
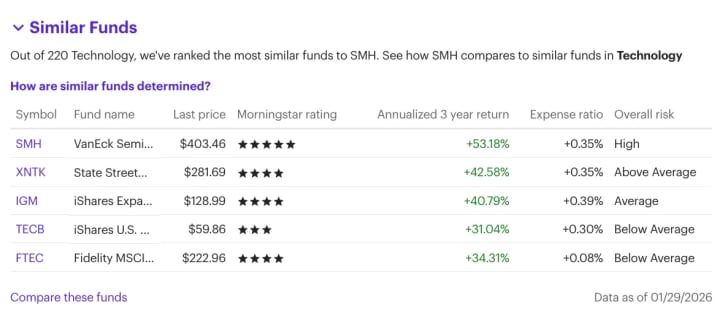
Before committing to any ETF, it's smart to see what alternatives exist.
This section compares SMH to other semiconductor and technology ETFs. You can evaluate:
- Expense ratios - Is there a cheaper option?
- Returns - Has another fund outperformed?
- Ratings - How do they stack up on quality?
For example, you might find a similar fund with lower fees or broader diversification. Or you might confirm that SMH is the best choice for your goals. Either way, comparison shopping is always worth the two minutes it takes.
Sustainability / ESG Scores
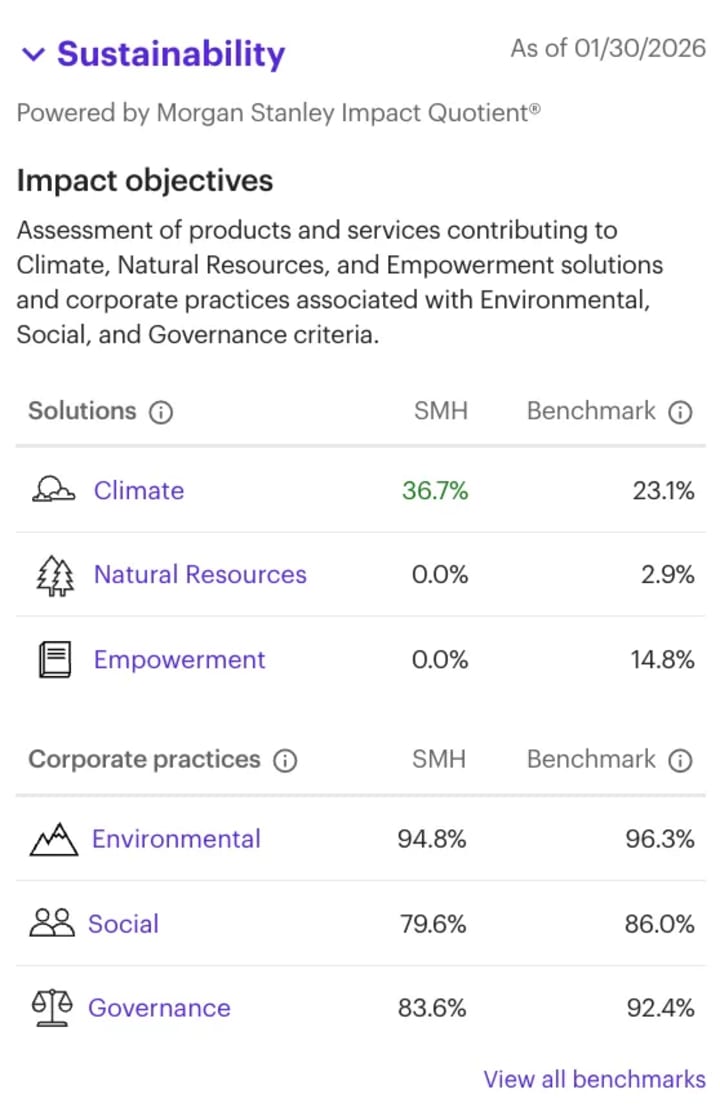
For investors who care about environmental, social, and governance factors, this section breaks down how the fund scores across various criteria:
- Climate - Carbon footprint and environmental impact
- Social - Labor practices, community relations
- Governance - Board structure, executive compensation, ethics
The section also flags "exposures" to controversial areas like weapons, tobacco, or private prisons.
Some investors prioritize these factors heavily. Others ignore them entirely. The information is here if it matters to your investment philosophy.
News: Staying Informed
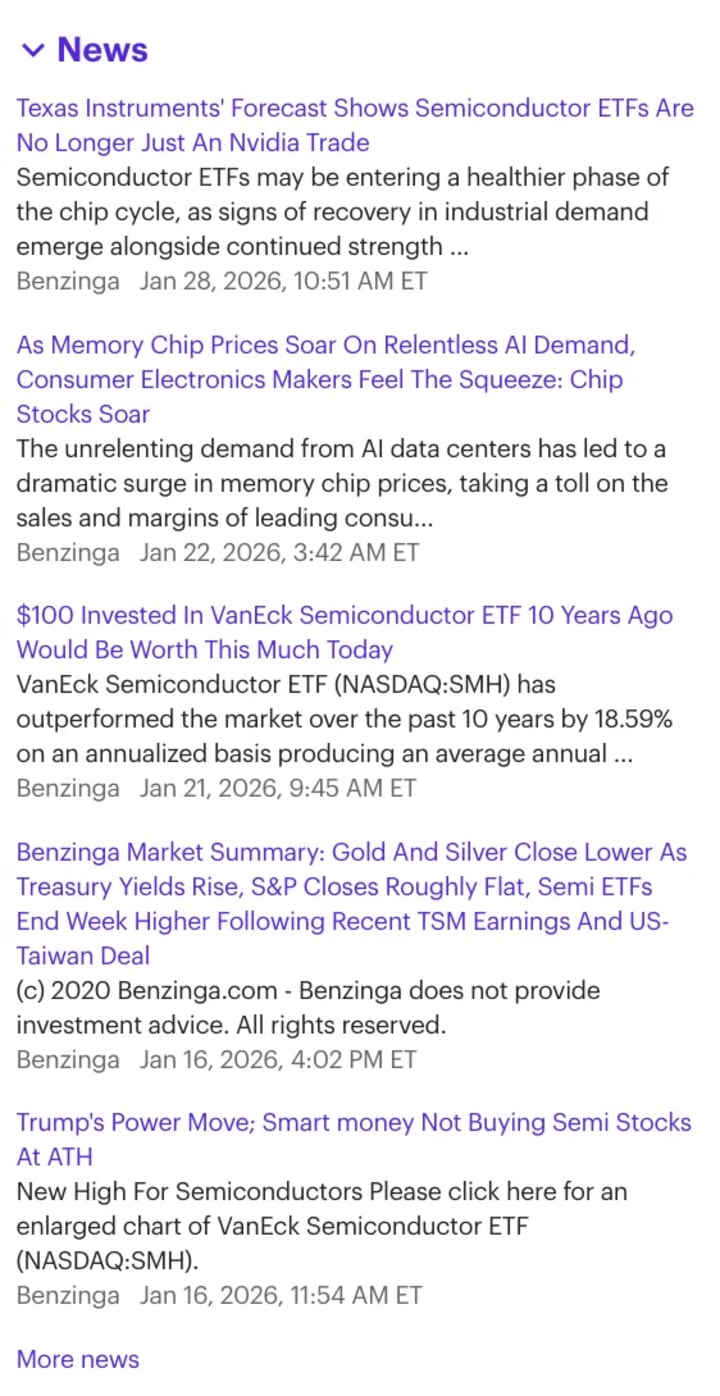
The news feed aggregates recent headlines related to the ETF and its holdings.
You'll see stories about semiconductor demand, AI trends, individual company earnings, analyst upgrades and downgrades, and broader market commentary.
I recommend scanning the news before making any investment and checking back periodically to stay informed. A single headline about chip tariffs or supply chain disruptions can move the entire sector.
Options Chain (Advanced)
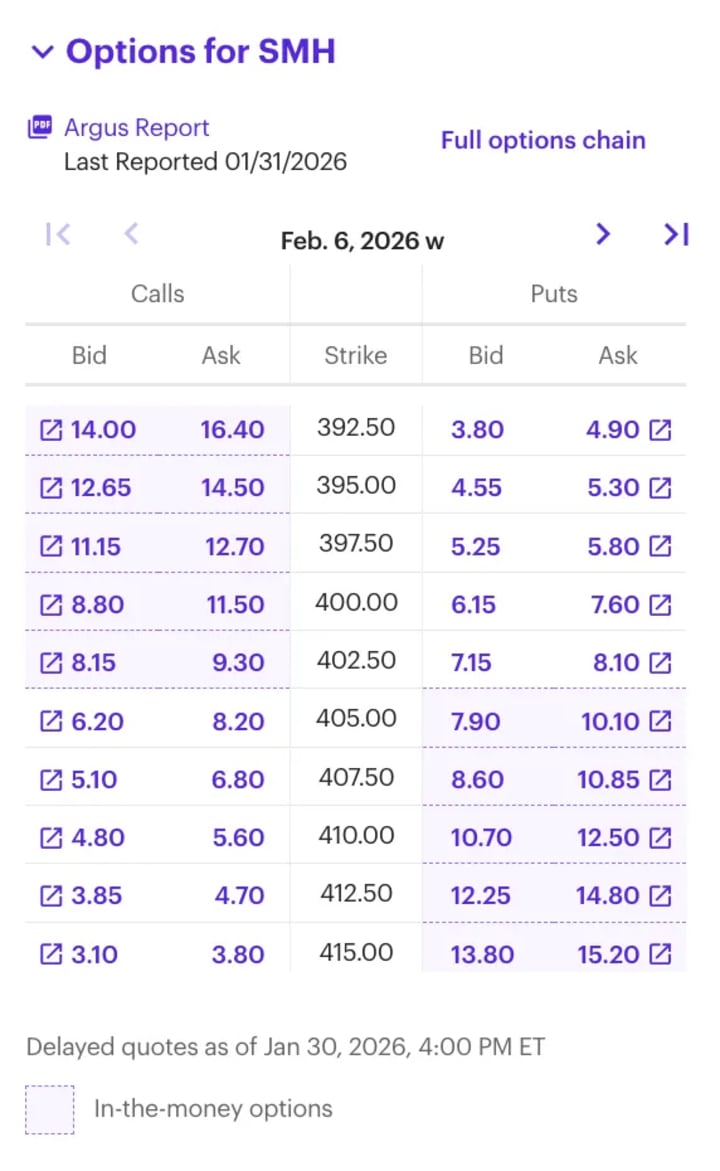
At the bottom of many ETF pages, you'll find an options chain showing calls and puts at various strike prices and expiration dates (I recall doing some options on another stock; I lost thousands due to making uninformed decisions. Be sure you do your research partner 😎).
If you're a beginner, you can safely ignore this entire section. Options are leveraged instruments used for speculation or hedging, and they require a solid understanding of derivatives before trading.
Once you're more experienced - and if your brokerage has approved you for options trading - this data becomes useful. But for now, focus on understanding the fundamentals first.
Putting It All Together
You've just learned how to read an entire ETF page. Here's the quick summary:
- Current price and today's movement
- Key Stats
- Trading activity and price ranges
- More Key Stats
- Fund structure, fees, dividends
- Charts and Visual price history across timeframes
- Strategy
- What the ETF is designed to do
- Holdings: What you actually own (MOST IMPORTANT)
- Performance
- Historical returns
- Dividends
- Income payment history
- Ratings
- Third-party quality assessment
- Similar Funds
- Alternative options to compare
- News: Recent headlines affecting the fund
The Cheat Sheet: What To Look For
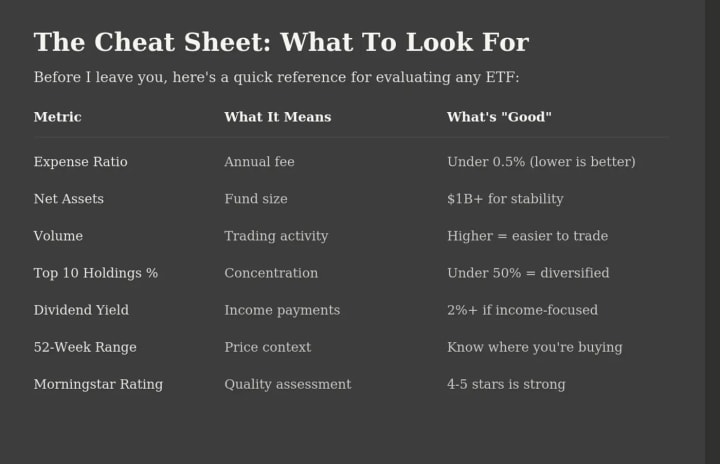
Before I leave you, here's a quick reference for evaluating any ETF:
Last Note For You Partner
The first time you look at an ETF page, it feels like drinking from a firehose. But once you know what each section means, it becomes second nature.
The most important thing to remember: always check the holdings. That's where you see what you're actually buying. Everything else is context.
Now go pull up an ETF you've been curious about and practice reading the page yourself. The more you do it, the faster it becomes.
Knowledge is power - especially when it's your money on the line.
Want to start investing but don't know where to begin?
---
Disclaimer: This article reflects my personal experience and is for educational purposes only. It does not constitute financial advice. Past performance does not guarantee future results. Consult a financial advisor before making investment decisions.
About the Creator
Destiny S. Harris
Writing since 11. Investing and Lifting since 14.
destinyh.com
Keep reading
More stories from Destiny S. Harris and writers in Trader and other communities.
Australia Subscription E-Commerce Market: Consumer Convenience, Recurring Revenue & Digital Growth
Australia Subscription E-Commerce Market Overview The Australia subscription e-commerce market is undergoing rapid transformation as businesses and consumers embrace recurring purchase models, personalised delivery experiences and digital-first shopping behaviours. Subscription e-commerce refers to online retail models where consumers opt into regular, automated delivery of products or services — ranging from everyday essentials like groceries and personal care items to niche offerings such as pet boxes, curated fashion and lifestyle memberships. The Australia subscription e-commerce market size reached USD 5.56 Billion in 2024. Looking forward, IMARC Group expects the market to reach USD 125.64 Billion by 2033, exhibiting a growth rate (CAGR) of 41.40% during 2025-2033. This strong growth reflects shifting consumer preferences toward convenience, personalised experiences and frictionless fulfilment supported by advanced digital platforms.
By Manisha Dixit6 days ago in Trader
New Export Support Welcomed as PTC Seeks to Quell Concerns Over India–EU Trade Deal
India’s export community has cautiously welcomed a fresh set of government-backed support measures aimed at strengthening overseas shipments, as the Policy Think Council (PTC) moved to address growing concerns around the proposed India–European Union (EU) trade deal. With negotiations entering a crucial stage, exporters and industry stakeholders have been voicing fears that heightened competition and regulatory demands from Europe could strain domestic industries. The PTC, however, says the new export support framework is designed to soften the impact and help Indian businesses remain competitive in one of the world’s most demanding markets.
By Salaar Jamaliabout 14 hours ago in Trader
After the Storm
After the storm of winter snow there sat a small bear by the name Ted, of course. He loves the snow and likes to roll around in it making all sorts of trails and whatever he has a mind to do. He wondered where all the people are, but in a way, he is hoping that they are all snug in the homes maybe drinking hot chocolate-one of his favorite drinks with mini-marshmallows and eating something homemade for he likes this winter wonderland all to himself to romp and play and maybe even catch some fish down by the river.
By Mark Graham4 days ago in Fiction


Comments
There are no comments for this story
Be the first to respond and start the conversation.